Block 3 Artificial Intelligence:
Week 3 Day 3 Homework Assignment:
Linear Regression, Non-Linear Regression, CART
-
Your task on the daily assignment is to get the best possible prediction on a test set (30% of corpus) using feature selection and feature transformation.
- Describe the analysis used to make your final data set and the regression machine(s) used for your predictions.
 —
—
Description of my process
- Feature Selection:

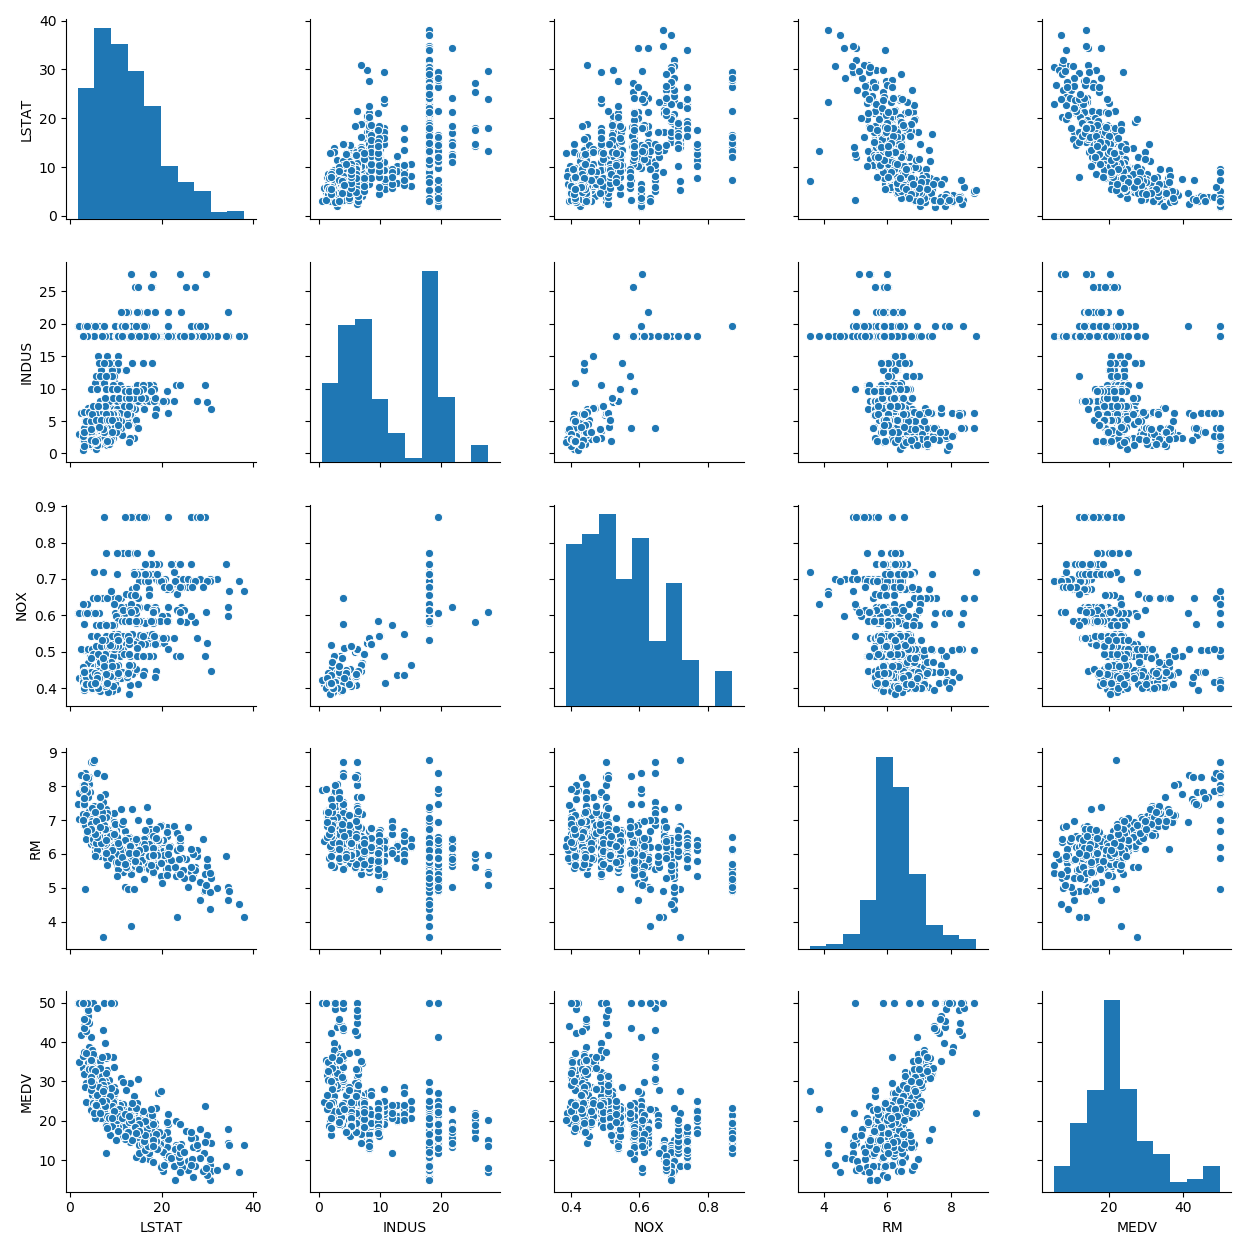
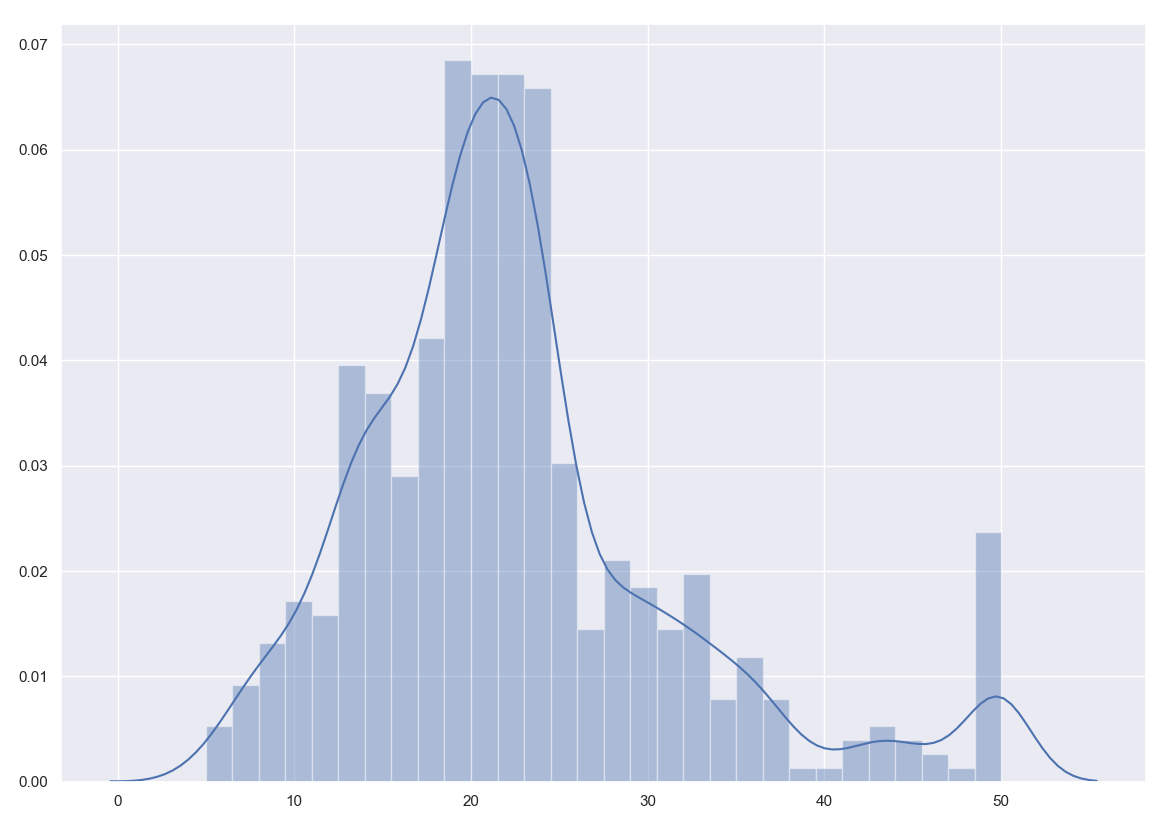
After loading in the Boston Housing Data and importing the necessary libraries for the duration of the project. I began by separating the data into different portions (Rest of the Data(13/14 columns), Label / Target Data (14th column)). I immmediately tested to see if any of the data was empty or NAN. After seeing that all the data was filled out, I printed the distribution/histogram plot of the MEDV (target) and found it to be pretty normally distributed with little outliers in the data.
- Feature Transformation:

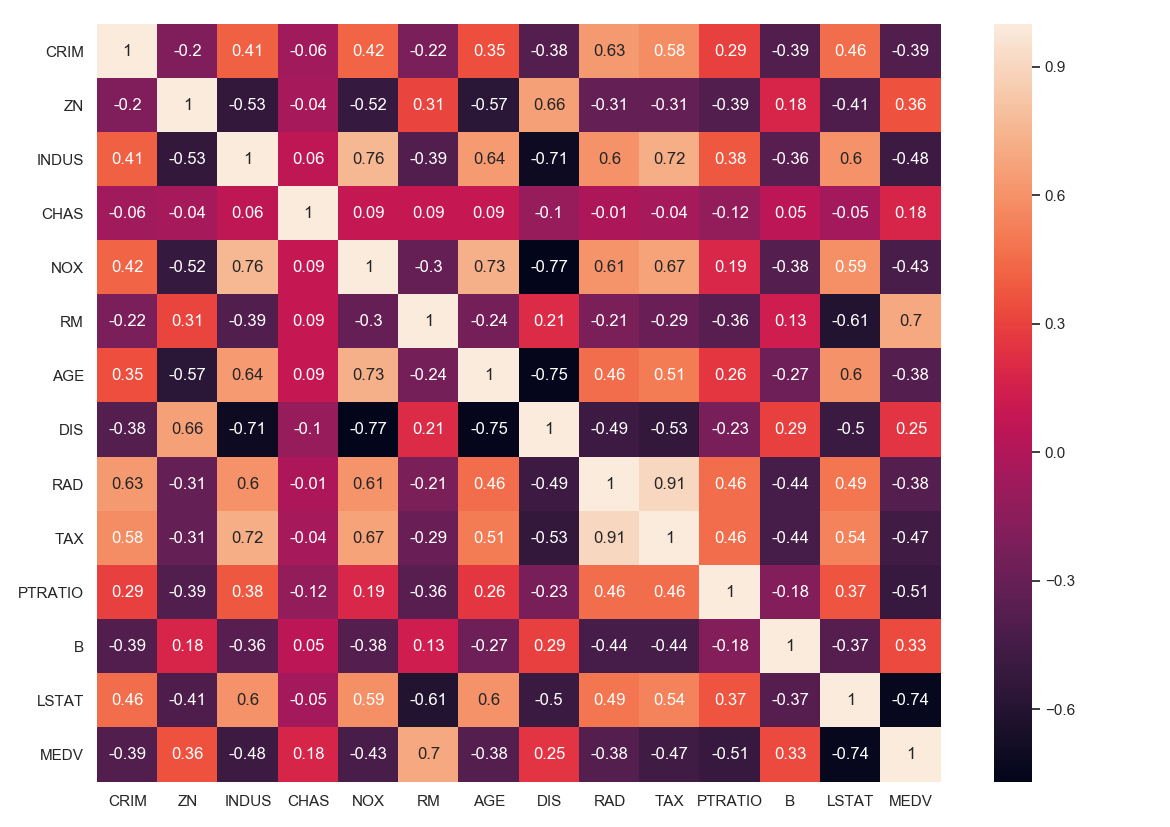
after realizing the data was fine, I plotted the correlation matrix in the form of a heatmap and selected the features that were highly correlated with the target value MEDV. I created X which is a dataframe that contains the most highly correlated values(w.r.t Target). I began to train_test_split the dataset into thee required 70 / 30 split. This is where I began to fit and train the data in various models
Day 1 Results
Time Invested: (11/7/2018 7pm - 11/8/2018 2:15am)
-
Analysis used to make the final data set: I determined the final data set should be the kth most highly correlated features. I then made a dataframe containing the kth best features. I did not use any Standard Scaler on the new DataFrame.
-
Regression Model(s) used for prediction:
- Linear Regression
- Lasso Regression
- Quadratic Fit
- Attempted Ridge Regression (?)
My Best Results came from the Quadratic Fitted Linear Regression:
- Training MSE quadratic: 14.284 equal to RMSE of 3.779
- Training R^2 quadratic: 0.837
- Testing MSE quadratic: 13.379
- Testing R^2 quadratic: 0.820
Next Potential Steps:
- After discussing this with Dr. Richard, I will be testing SVM on the dataset today
- Transform Feature on one of the two dimensions apply log
- Use Principal Component Analysis
Day 2 Results
Time Invested: (11/8/2018 1:20pm - 2:02pm, 9pm - 11:52pm )
- Started the second day taking Richard’s last recommendation to Scale the Values
- Record the results across the various Machines
- Then discuss with Richard the potential of dimensionality reduction and it’s immplications on the data
Linear Regression results for StandardScaled Data: RMSE is 0.5668831576470151 this is much better than the Quadratic Curve in Day 1 R2 score is 0.6786434855761492
Quadratic Regression results for StandardScaled Data: RMSE quadratic: 0.416 R^2 quadratic: 0.827
quadratic is still outperforming the linear regression with it’s RMSE score being the best among all runs and having a high correlation amongst the chosen features it is doing well.
–UPDATE @ 11:18pm–
By using PCA and reducing the dimensions of the second dataframe made of value that had the best correlation with the target, I was able to fix the problem with the training set having a better score than the test set
>The model performance for training set
--------------------------------------
 RMSE is 0.6047551265167522
 R2 score is 0.6487385786896802


>The model performance for testing set
--------------------------------------
RMSE is 0.5927358668036734
R2 score is 0.6019543580919947
–UPDATE @ 11:48pm–
I was able to get the Linear Model and Quadratic Models to reduce their RMSE measure with the train set error being slightly worse than the test set RMSE measure.
NOTE: This does not apply to the Cubic Model for some reason
Short Comings:
Because I got back to working on this after my adjunct and sending a good portion of my day looking for Higher Order Neural Network Results and in the worse case an alternative project that will fit within the time constraint, I was unable to add the remaining features that I discussed with the Professor
- The Regularization Terms
- The SVM, due to fixing the training vs test error problem
- Potential using dimensionally reduction or apply math functions on certain features to reduce their complexity
It was still really cool to try to apply what I learned in Class freely on this Dataset. I would highly recommend anyone interested in Data Science try it